What Is Stop Hunting in Trading?
In the fast-paced world of financial trading, few concepts are as misunderstood — and as costly to ignore — as stop hunting. Every day, thousands of retail traders watch in frustration as the market appears to move directly against their position before reversing sharply in the original direction, leaving them stopped out and on the sidelines of a perfectly good move. This guide breaks down exactly what stop hunting is, how it works, why it happens, and most importantly, how you can stop being the victim and start being on the right side of these powerful market moves.
What Is Stop Hunting?
Stop hunting is one of those topics that separates traders who truly understand market dynamics from those who are perpetually confused by price behavior.
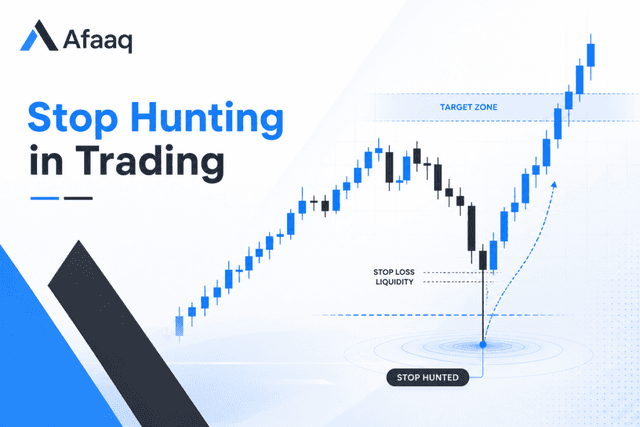
Stop hunting refers to a deliberate market move — typically driven by institutional players, banks, or large funds — that pushes the price into areas where retail traders have clustered their stop-loss orders, triggering those stops before the price reverses sharply in the opposite direction. In plain terms, the market appears to “go after” your stop loss specifically, collect the liquidity sitting there, and then head in the direction you originally anticipated.
This isn’t paranoia — it’s mechanics. When thousands of retail traders place stop losses below obvious swing lows or above clear swing highs, those stops collectively represent a significant pool of stop-loss liquidity that larger players can use to fill their own massive orders at favorable prices.
Why Does Stop Hunting Exist?
To understand why stop hunting happens, you need to understand a fundamental problem that institutional traders face: size.
When a hedge fund or investment bank wants to enter a position worth hundreds of millions of dollars, it can’t simply click “buy” at the current market price. An order that large would move the market against them before their entire position is filled. They need liquidity — willing sellers (for buy orders) or willing buyers (for sell orders) — to fill their positions efficiently.
Where do they find that liquidity? Exactly where retail traders place their stops — below key swing lows and above obvious swing highs. By pushing price into these zones, institutions trigger retail stop orders (which become market orders when hit), providing the liquidity needed to fill institutional positions at desired prices.
The cycle works like this:
- Retail traders enter long positions and place stops below obvious swing lows
- Institutions identify this stop cluster as a liquidity pool
- Price is pushed downward to trigger those stops — this is the liquidity grab
- Triggered stop orders flood the market with sell orders, which institutions absorb as buy orders
- With their positions now filled, institutions drive price upward — often aggressively
- Retail traders watch their stopped-out positions move strongly in the direction they originally intended
Identifying Stop-Loss Liquidity Zones
Understanding stop hunting starts with thinking like the institutions hunting those stops. And to do that, you need to understand where retail stops tend to cluster.
The most common locations where retail traders park their stop losses include:
- Below obvious swing lows in an uptrend (the classic “support level” stop)
- Above obvious swing highs in a downtrend (the classic “resistance level” stop)
- Below round numbers (price levels ending in .00 or .50 are psychologically significant)
- Below moving averages (many traders stop out just below the 50 or 200 EMA)
- Below chart pattern boundaries (flag patterns, triangles, head and shoulders necklines)
- Just outside Fibonacci retracement levels (the 61.8% level is a particularly popular stop placement)
The more obvious a level is on a chart, the more retail stops are likely clustered there — and the more attractive it becomes as a target for institutional activity.
Recognizing Liquidity Pools on a Chart
A liquidity pool is simply any area where stop orders are likely to be concentrated. On a price chart, these zones are relatively easy to identify once you know what to look for:
- Equal highs and equal lows are particularly powerful liquidity zones. When price tests the same level multiple times without breaking through, retail traders interpret this as strong support or resistance and place their stops just beyond it. In reality, these equal levels are magnets for stop hunting activity.
- Trendline stops represent another major pool. Traders who draw trendlines and place stops just beyond them create predictable clusters that institutional players are well aware of.
Price Manipulation and the Fake Breakout
Price manipulation in retail financial markets takes many forms, but the fake breakout is arguably the most common and most damaging to retail traders.
A fake breakout — also known as a fakeout — occurs when price breaks decisively through a key level, triggering breakout traders to enter and stop-loss traders to exit, before reversing sharply back through the broken level and continuing in the original direction. It’s a two-for-one manipulation: it hunts the stops of traders already in positions while simultaneously trapping new traders who entered on the breakout.
Here’s how a typical fake breakout unfolds in a bullish market:
- Price approaches a well-established resistance level that has been tested multiple times
- Breakout traders set buy orders above the level, anticipating a genuine break
- Long traders already in position place stops below recent swing lows
- Price pushes aggressively upward, triggering breakout buy orders
- Price immediately reverses — now trapped longs panic and exit, creating more sell-side liquidity
- Price sweeps down through the swing lows, hunting the stops of original long traders
- With liquidity collected on both sides, institutional buyers absorb everything and drive the price strongly higher
This engineered sequence is not a coincidence. It’s a deliberate pattern that repeats across all markets and all timeframes.
Characteristics of a Genuine Fake Breakout
Learning to spot the difference between a real breakout and a fake breakout is a skill that directly translates to saved capital and better entries. Key characteristics of fake breakouts include:
- Weak momentum into the break: The breakout happens on thin volume with no conviction
- Immediate reversal: Price doesn’t spend time above/below the broken level — it reverses within one to three candles
- Long wicks: The breakout candle often shows a long wick beyond the level with a close back inside
- No follow-through: Unlike genuine breakouts, fake breakouts don’t create new structural levels — they simply sweep and reverse
Smart Money Tactics Reading Institutional Footprints
Profiting from stop hunting means aligning yourself with institutional activity rather than fighting it. This requires a fundamental mindset shift — instead of asking “where should I place my stop?” you should be asking “where will the market hunt stops before making its real move?”
Professional traders who use Smart Money frameworks approach every setup with this institutional lens. They actively look for stop hunting setups as high-probability entry opportunities rather than viewing them as threats to their existing positions.
The institutional trading cycle follows a predictable pattern:
- Accumulation — Institutions build positions quietly, often within a tight range
- Manipulation — Price is driven into stop clusters to collect liquidity (stop hunting phase)
- Distribution/Expansion — The real move begins, often sharp and sustained
The stop hunting phase (manipulation) is actually the most valuable signal in this sequence — it tells you that institutions have collected their liquidity and are likely about to make their directional move.
Order Blocks and the Stop Hunt Relationship
After a stop hunt, price typically leaves behind what SMC traders call an order block — the last significant candle before a strong impulse move. These order blocks represent the exact price levels where institutional orders were filled during the liquidity grab.
When price retraces to these order blocks after the initial move, it often finds strong support or resistance — giving traders who understand this concept a precise entry point with a tight, logical stop placement well away from the hunted zone.
How to Protect Yourself From Stop Hunting?
The good news is that once you understand how stop hunting works, you can take concrete steps to protect your capital and even turn these patterns to your advantage.
Strategy 1 — Stop Placement Away From Obvious Levels
Never place your stop loss exactly at the obvious level. If you’re long and the nearest swing low is at 1.2500, don’t place your stop at 1.2490. Give the trade room to breathe by placing the stop at a structurally logical level further away, below the next significant swing low, or below the order block associated with the move.
Strategy 2 — Wait for the Hunt Before Entering
Instead of entering before the obvious level is tested, wait for the stop hunt to occur first. If you expect the price to sweep below a swing low before moving higher, be patient. Let the sweep happen, watch for a strong reversal candle, and enter after the hunt is confirmed. This one adjustment can transform your trading dramatically.
Strategy 3 — Use Limit Orders Instead of Stop Market Orders
Stop market orders convert to market orders when triggered, often resulting in poor fills during fast-moving stop hunt conditions. Using limit orders to define your entry gives you control over your execution price and helps you avoid chasing manipulated moves.
Step-by-step approach to avoid being hunted:
- Identify the obvious stop cluster level on the chart
- Mark the zone slightly beyond that level where the hunt is likely to reach
- Wait for the price to sweep into that zone
- Look for a strong rejection candle (pin bar, engulfing, or similar)
- Enter on the close of the rejection candle or on a retracement
- Place a stop beyond the extreme of the hunt candle
- Target the next structural level or previous swing high/low
Stop Hunting Across Different Markets
Stop hunting behavior is not exclusive to any single market — it appears consistently across forex pairs, commodity markets, equity indices, and individual stocks. However, the intensity and frequency of stop hunting activity vary depending on the liquidity profile of each market.
- Forex Markets: The most active arena for stop hunting due to the decentralized, 24-hour nature of currency trading. Major pairs like EUR/USD, GBP/USD, and USD/JPY regularly exhibit classic stop hunt patterns, particularly around the London open and New York open when institutional volume surges.
- Commodity Markets: Gold (XAUUSD) is particularly well known for aggressive stop hunting behavior. The daily swings in gold frequently sweep below key support levels or above resistance levels before reversing — a pattern that consistently traps retail traders while filling institutional positions.
- Stock Indices: CFDs on major indices like the S&P 500, NASDAQ, and DAX also exhibit stop hunting behavior, especially around major economic data releases. Pre-market manipulation is a well-documented phenomenon in index trading.
At AFAQ Trade, you have direct access to all of these markets — forex pairs, commodities including gold and oil, and major global indices — all from a single platform. This means you can apply your stop hunting awareness across multiple instruments and find the setups with the highest conviction regardless of which market is presenting the opportunity.
Why AFAQ Trade Helps You Trade Smarter Against Stop Hunting?
Knowledge of stop hunting is powerful, but it’s only effective when paired with a platform that gives you the tools to act on that knowledge quickly and precisely. This is exactly why serious traders in the Gulf region choose AFAQ Trade as their trading home.
AFAQ Trade’s Web Trader platform and mobile app are built for traders who think beyond the basics. The platform integrates Autochartist — an advanced pattern recognition tool that helps identify key structural levels where stop clusters are likely to form, giving you a technical edge in anticipating where the next hunt might occur.
Additionally, the TipRanks integration available through AFAQ Trade provides fundamental context that helps confirm whether an anticipated stop hunt aligns with broader market sentiment and institutional positioning — a powerful combination of technical and fundamental analysis in one place.
For traders who are still building their understanding of institutional behavior and stop hunting patterns, AFAQ Trade’s trading academy offers structured educational content covering advanced topics like price manipulation, institutional trading concepts, and risk management — everything you need to develop genuine market literacy.
And for those who prefer to learn by observing, the copy trading feature allows you to follow experienced traders in real time, watching how they navigate stop hunting zones and institutional setups firsthand.
FAQs
Is stop hunting illegal or considered market manipulation?
In regulated markets, deliberate price manipulation is prohibited and monitored by financial regulators. However, stop hunting as a natural consequence of liquidity-seeking behavior by large players exists in a grey area — particularly in decentralized markets like forex, where no single regulatory body oversees global price action.
How can I tell the difference between a genuine breakout and a stop hunt?
The key distinction lies in momentum, follow-through, and candle structure. A genuine breakout typically features strong, high-momentum candles with full bodies closing well beyond the broken level, followed by continuation and the establishment of new structural highs or lows. A stop hunt, by contrast, usually involves a sharp spike beyond a key level with a quick reversal — often visible as a long wick on the breakout candle — with price closing back inside the range.
Do stop hunts happen on all timeframes?
Yes, stop hunting behavior occurs across all timeframes, from the one-minute chart all the way up to the weekly chart. However, the significance and reliability of stop hunts increase with the timeframe.
Should I widen my stop loss to avoid being hunted?
Widening your stop loss without a structural reason behind it is not the solution — it simply means you lose more capital when a trade goes wrong. The correct approach is to relocate your stop to a structurally logical level that is beyond where the likely hunt will reach.
Can beginners use stop hunting strategies effectively?
Stop hunting concepts are more advanced than basic support and resistance trading, but they are absolutely accessible to dedicated beginners who invest time in understanding market structure and institutional behavior.