Why Are Japanese Candlesticks So Important in Trading?
Trading in the financial markets is often compared to reading a language—a language written not in words but in charts and patterns. Among the many charting tools available to traders, Japanese candlesticks have stood the test of time as one of the most reliable and visually intuitive methods of analyzing price movements. Whether you trade stocks, forex, or commodities, mastering Japanese candlesticks can help you interpret market psychology, predict potential reversals, and make better-informed decisions.
This comprehensive guide explores how Japanese candlesticks work, how to interpret them, the key patterns you should know, and how to integrate them into your trading strategy.
What are Japanese Candlesticks?
Japanese candlesticks are one of the most widely used tools for technical analysis in financial markets. Originating in Japan during the 18th century, they were first developed by rice traders to track price fluctuations. The system was later introduced to the Western world by Steve Nison in his famous book, Japanese Candlestick Charting Techniques.
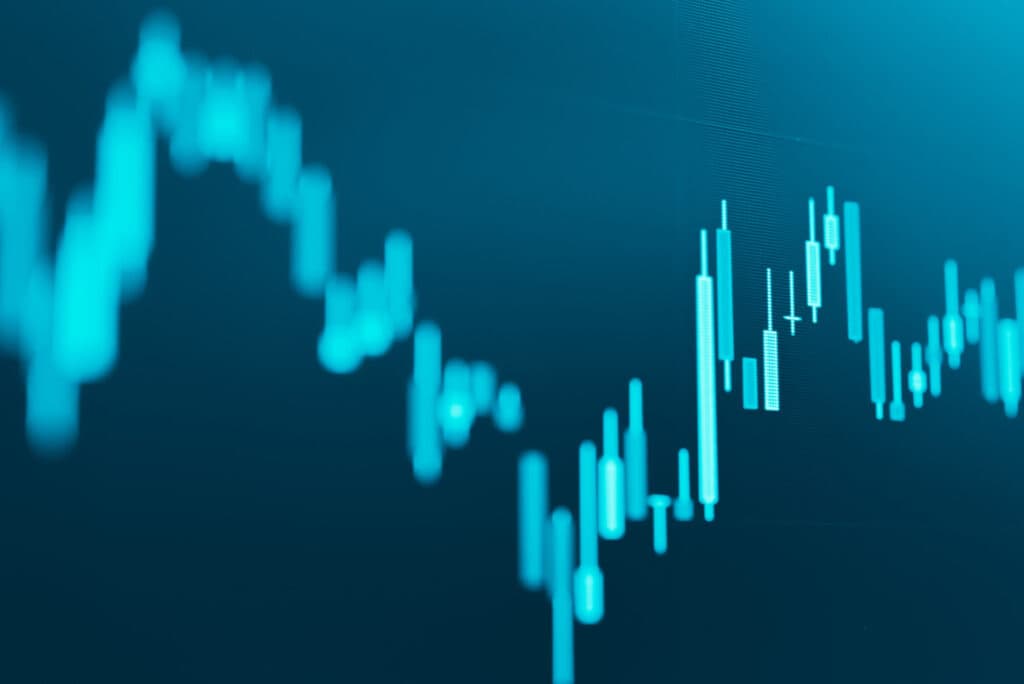
Each candlestick represents a unit of time—such as one minute, one hour, or one day—and provides vital information about a market’s open, close, high, and low prices. The body of the candle shows the difference between the opening and closing prices, while the wicks (or shadows) illustrate the price extremes during that time period.
Modern traders on platforms like AFAQ use these candlesticks to assess market sentiment, momentum, and potential reversals. Unlike traditional bar charts, Japanese candlesticks forex and stock charts offer visual clarity, making it easier to spot patterns and trading opportunities.
How to Read Japanese Candlestick Patterns?
Reading Japanese candlesticks is like interpreting market emotions. A long green or white body indicates strong buying pressure, while a long red or black body reflects strong selling pressure. Small bodies often represent indecision or consolidation phases.
Candlestick patterns come in single, double, and triple formations. A single candle, such as a Japanese candlestick hammer or doji, may signal a reversal. A double pattern, like a bullish or bearish engulfing formation, reflects a stronger change in sentiment.
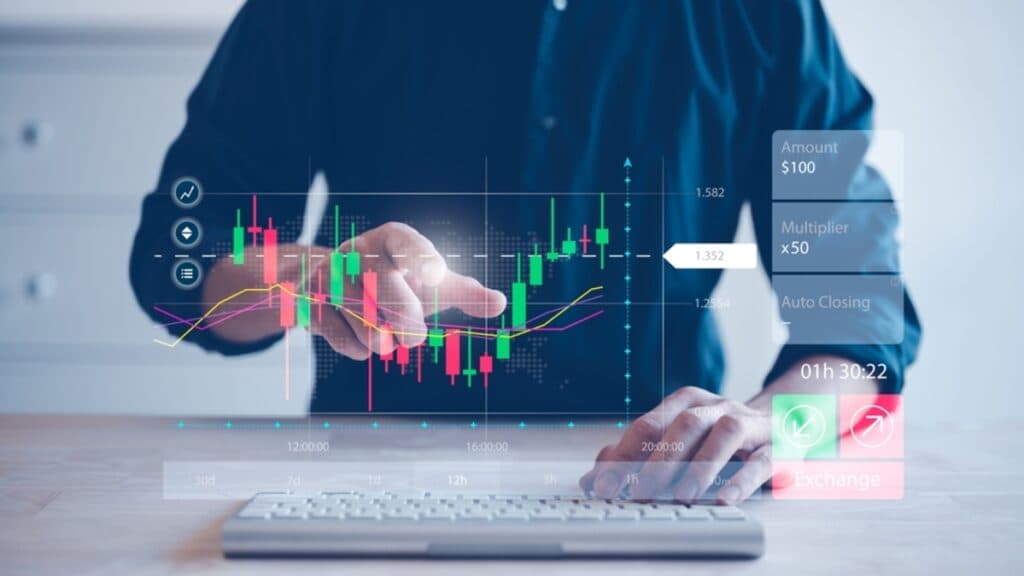
When using the AFAQ trading platform, traders can easily zoom into charts, draw trend lines, and overlay indicators to confirm candlestick signals. This feature-rich environment supports traders in making informed decisions based on candlestick patterns, whether they are day trading, swing trading, or engaging in long-term investing.
Structure of a Japanese Candlestick
A Japanese candlestick visually represents market price movements within a specific time frame. It’s a key tool that helps traders interpret market trends and sentiment.
Body, Wick (Shadow), and Color
Each Japanese candlestick has three main parts—the body, the wick, and the color. The body represents the open and close prices within a chosen time frame. The upper wick marks the highest traded price, and the lower wick indicates the lowest. The color denotes direction: green or white for bullish candles (close higher than open), and red or black for bearish candles (close lower than open).
Bullish vs Bearish Candles
A bullish candlestick shows strong buying pressure—demand outweighing supply. Conversely, a bearish candle reflects selling dominance. Analyzing consecutive bullish or bearish candles can reveal the strength of a trend.
At AFAQ, traders can customize chart visuals and colors according to their preferences. Whether trading on desktop or mobile, AFAQ’s mobile trading application ensures all candle data is displayed clearly for seamless technical analysis.
Importance of Japanese Candlesticks in Trading
Japanese candlesticks play a vital role in technical analysis, offering traders valuable insights into market momentum and potential price reversals.
How Do They Represent Price Action?
Japanese candlestick patterns are crucial for understanding market psychology. Each candle captures a battle between buyers and sellers, reflecting the balance of power within that period. This visual representation of price action helps traders identify momentum and reversals before other indicators confirm the trend.
Why Traders Rely on Candlestick Analysis?
Traders across all asset classes rely on Japanese candlesticks trading because they combine technical precision with psychological insight. For example, when a Japanese candlestick doji appears after a long bullish run, it suggests indecision—a possible reversal sign.
AFAQ provides traders with advanced charting tools, including candlestick overlays, to identify these signals across forex, stocks, and commodities.
Common Japanese Candlestick Patterns
Common Japanese candlestick patterns help traders identify potential market shifts. They serve as powerful signals for predicting price movements and trend changes.
Doji
The Japanese candlestick doji occurs when the open and close prices are nearly identical, creating a cross-like shape. It represents market indecision and often signals a potential reversal after strong trends.
Hammer and Hanging Man
The Japanese candlesticks hammer appears after a downtrend and suggests a bullish reversal. In contrast, the hanging man forms after an uptrend, warning of potential weakness.
Engulfing Patterns
An engulfing pattern consists of two candles. A bullish engulfing pattern forms when a small red candle is followed by a large green one that completely engulfs it—indicating a potential upward move.
Morning Star and Evening Star
These are three-candle reversal formations. The morning star signals a bullish reversal, while the evening star warns of a bearish change.
Shooting Star
The shooting star has a small body and a long upper wick, usually forming at the end of an uptrend—hinting at a downward reversal.
AFAQ’s charts make spotting these Japanese candlestick patterns straightforward with visual markers and alerts to support timely trades.
Advanced Japanese Candlestick Patterns
Advanced Japanese candlestick patterns provide deeper insights into market psychology. They help experienced traders refine their strategies and anticipate complex price actions.
Three White Soldiers
This bullish pattern consists of three consecutive long green candles, each closing higher than the last. It signals strong momentum.
Three Black Crows
This bearish reversal pattern features three long red candles, each closing lower—indicating sustained selling pressure.
Harami Patterns
A harami is a two-candle pattern where the second candle is contained within the first, signaling indecision or reversal.
Spinning Tops
Spinning tops have small bodies and long wicks on both sides, showing market uncertainty.
Advanced traders on AFAQ often combine Japanese candlestick bible concepts with technical indicators like RSI, MACD, or moving averages to validate patterns and optimize entry points.
Using Japanese Candlesticks in Trading Strategies
Using Japanese candlesticks in trading strategies allows traders to make informed decisions. They offer clear visual cues that enhance market analysis and timing precision.
Trend Continuation Patterns
Candlestick formations such as rising three methods or falling three methods help traders confirm ongoing trends.
Reversal Patterns
Reversal patterns like the hammer, doji, or engulfing signal a potential change in direction, allowing traders to position themselves early.
Combining Candlesticks with Technical Indicators
Combining candlestick patterns with indicators enhances accuracy. On the AFAQ platform, traders can overlay Fibonacci retracements or Bollinger Bands with Japanese candle charting techniques to strengthen trade confirmation.
By integrating Japanese candlesticks forex analysis with risk management tools, AFAQ helps traders build robust strategies that work across volatile markets.
Tips for Beginners
Getting started in trading can be overwhelming for beginners. With the right guidance and consistent learning, anyone can build a strong foundation for success.
Practicing with Demo Accounts
Beginners should first use a forex trading demo account to understand how candlesticks behave in live conditions without risking real money.
Recognizing Key Signals
Start by identifying common patterns such as the hammer, doji, or engulfing candles. Observing these in different market conditions enhances recognition skills.
Avoiding Over-Reliance on Patterns
While Japanese candlestick patterns are powerful, relying solely on them can be risky. Always combine candlestick insights with volume data and trend confirmation indicators.
Through AFAQ’s demo and educational resources, traders can master Japanese candlesticks trading at their own pace while gaining real-world experience.
Services Of Afaq
AFAQ Trade is an electronic platform specializing in trading Contracts for Difference (CFDs), with a primary focus on the Gulf markets.
The platform aims to provide a simple, secure, and professional trading experience through platforms such as WebTrader and Mobile App, supported by educational tools like webinars, an academy, demo accounts, and a copy-trading feature.
Licenses and Legal Entity
The platform is owned by Afaq FX Markets (Comoros) LTD, registered in Comoros.
It is licensed by the MWALI International Services Authority under license number BFX2025079, adding a layer of transparency and reliability for investors.
Key Services
- Trading in forex, stocks, commodities, and indices.
- Islamic accounts are compliant with Sharia.
- Demo account with $25,000 virtual funds for training.
- Advanced analysis tools, live customer support, and competitive trading fees (low spreads).
- Secure deposit and withdrawal procedures.
Account Types
- Basic – Minimum deposit up to $4,999.
- Advanced – From $5,000 to $19,999.
- Premium – $20,000 and above with advanced features.
- Sharia Account – Sharia-compliant, swap-free, with Sharia fees applied after the 4th day.
- Demo – Realistic trading experience with no financial risk.
In Conclusion
Mastering Japanese candlesticks is essential for anyone serious about trading. From identifying potential reversals to understanding market sentiment, candlestick analysis provides a visual and intuitive approach to price action.
Platforms like AFAQ empower traders with cutting-edge tools, real-time charts, and educational content that help them effectively apply Japanese candlestick charting techniques across forex, stocks, and commodities. Whether you are a beginner or a professional, learning candlestick analysis can transform your trading discipline and success rate.
If you are ready to elevate your trading knowledge and experience, start exploring AFAQ’s platform today—a trusted space for global traders who value precision, performance, and professional support.
FAQs
What is a Japanese candlestick called?
A Japanese candlestick is a charting tool that shows an asset’s open, close, high, and low prices within a specific time frame.
Do Japanese candlesticks work?
Yes. Japanese candlesticks trading works effectively because they visually represent market sentiment, helping traders anticipate moves before they occur.
How do you read Japanese candlesticks?
You interpret the candle’s body and wicks to determine buying and selling pressure. Green or white candles indicate buyers in control, while red or black candles suggest sellers’ dominance.
How to trade Japanese candlesticks?
Start by learning basic patterns, practice on AFAQ’s demo account, and combine candlestick insights with technical indicators for higher accuracy.